

2026 Semiconductor Market: AI Boom, Structural Shortages & Sourcing Tips
2026-09-16
Global semiconductor market sales reached USD 134.45 billion in June, marking the 16th consecutive month of month‑over‑month growth. Hua Hong’s fabs have been running at full capacity for nearly two years. Combined, these two figures illustrate the 2026 semiconductor market landscape: AI computing power acts as the primary demand driver, while supply is constrained by 8‑inch mature‑node capacity and advanced packaging. Price hikes have spread from niche product categories across the whole industry.
Global Semiconductor Market
Record‑High Sales with Inventory Falling to Three‑Year Lows
In June 2026, global semiconductor market sales hit USD 134.45 billion, representing a 123.6% year‑on‑year increase and 16 straight months of sequential growth, standing at an all‑time high.
Inventory levels and gross margins further validate the strong market momentum. In Q2 2026, average inventory days for major chip vendors dropped another 4 days to 118 days, the lowest reading in three years; average gross margin for key IC suppliers rose to 48.6%.
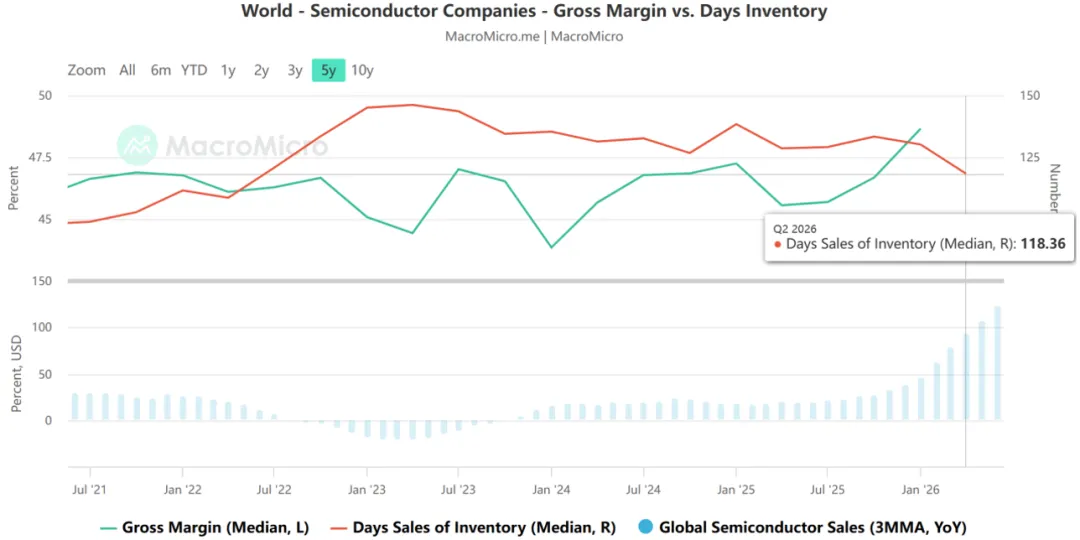
Rising volumes, higher selling prices, inventory drawdowns and expanding gross margins. These concurrent signals indicate the current upturn is driven by genuine end‑market demand rather than mere inventory restocking.
Nevertheless, the semiconductor industry follows a well‑defined inventory cycle. Major market peaks occurred in October 2014, October 2018 and May 2022, with cycle intervals ranging from 43 to 48 months. Historical patterns suggest the next cyclical peak will arrive around mid‑2026. Accordingly, the industry may now sit near the top of this cycle rather than at its early phase, calling for a structural view on future market movements.
Wafer Foundry
Full Utilization Becomes Norm; Price Hikes Gain Industry‑Wide Consensus
August wafer capacity and order data point to one clear trend: sustained high capacity utilization and widespread price increases.
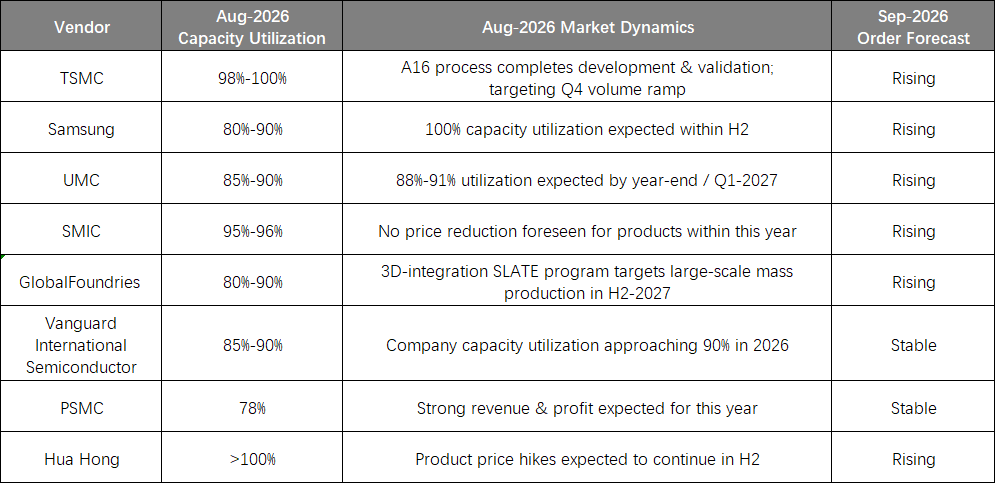
The supply landscape shows distinct structural divergence. AI compute demand tightens capacity for advanced nodes plus selected mature‑node processes for power‑related devices. Weakness in traditional consumer electronics, by contrast, eases supply pressure for general‑purpose chips.
The 8‑inch wafer segment faces the most acute pressure. Combined capacity contraction and surging AI power‑chip demand push utilization close to 90%, with price adjustments expanding from selective product platforms to broader portfolios.
A late‑June HSBC report delivered a more bullish outlook: it raised capacity‑utilization forecasts for second‑tier foundries including UMC, Vanguard, GlobalFoundries and SMIC, projecting 11% utilization growth in 2026 and 27% in 2027, well above consensus estimates of 1% and 7%. Price improvements are expected to persist from H2‑2026 through end‑2027.
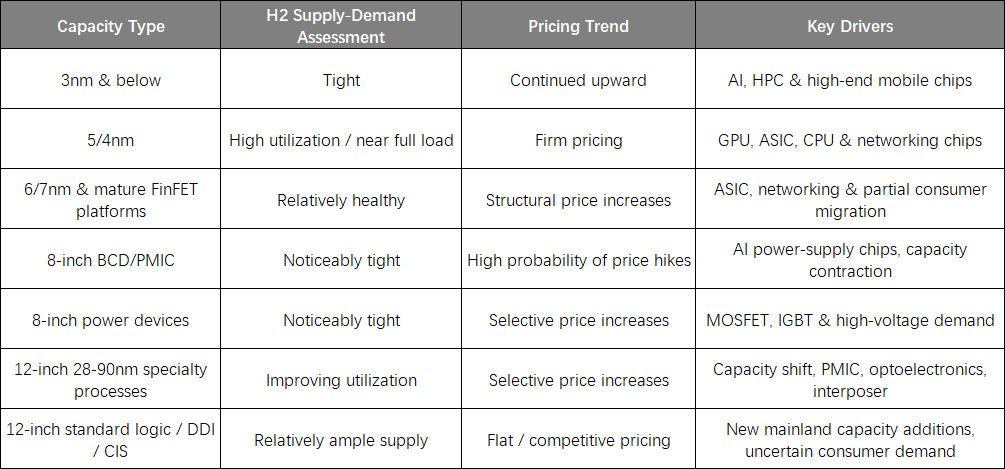
△ Forecast of wafer foundry capacity utilization versus price trends
Price escalation sequence: Advanced nodes → 8‑inch power‑device platforms → 12‑inch specialty processes → Standard mature nodes.
Important distinctions separate the current cycle from the 2021 boom. 2021 featured broad‑based demand expansion and inventory build‑up across all segments. Tightness in 2026 concentrates on three areas: advanced process nodes, 8‑inch power‑device platforms and 12‑inch specialty technologies. General‑purpose mature‑node capacity remains ample, lacking fundamental drivers for universal price inflation.
Packaging & Test
Structural Shortages, Near‑Full Utilization with Constrained Capacity Ramp‑Up
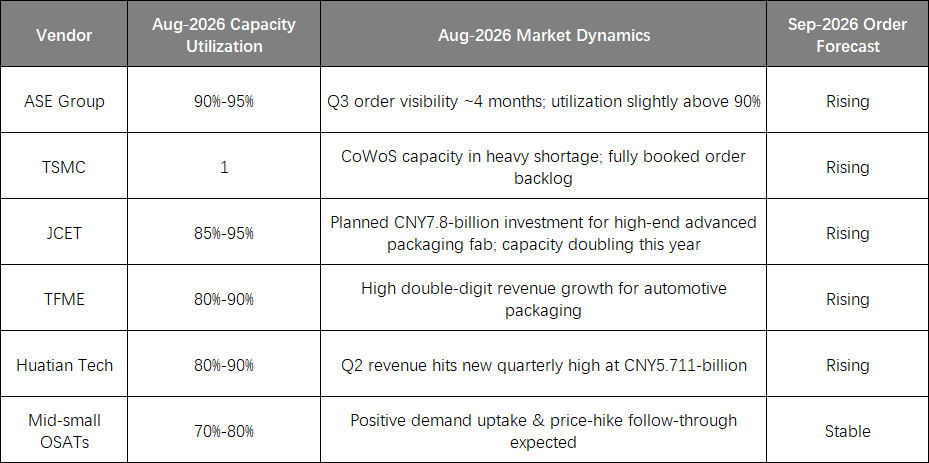
The packaging and test market can be summarized as “structural component shortages, high overall fab utilization and aggressive capacity expansion”. Yet three bottlenecks slow new‑capacity deployment, none of which can be resolved in the short run.
Equipment: Lead‑times for selected advanced packaging and test tools stretch beyond 12 months, delaying new production‑line activation.
Facilities: Construction cycles for high‑grade clean rooms are lengthy, and suitable real estate is scarce.
Materials: Short supply of high‑end copper‑clad laminates and ABF substrates impedes fast capacity ramp‑up.
For buyers, this means even with announced OSAT capacity expansions, real production volume comes with significant time‑lags. Suppliers will retain strong pricing power for packaging capacity in the near term.
Memory
Spot Prices Pull Back from Peaks; Shortage Shifts From Broad‑Based to Structural
Memory has delivered the most dramatic price swings in this cycle.
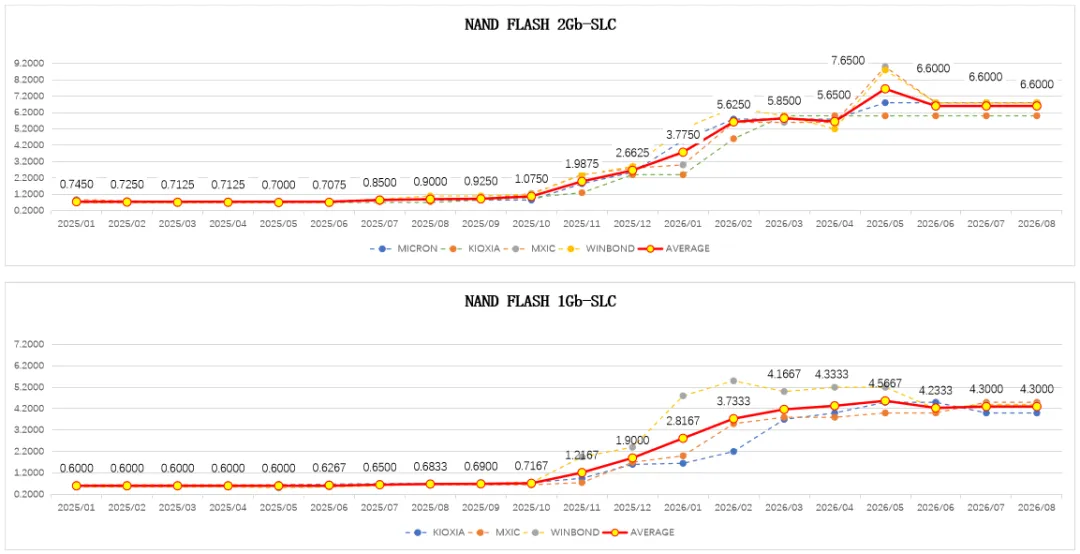
For NAND spot market: 2Gb‑SLC climbed from USD 0.745 in Jan‑2025 to USD 1.9875 in Nov‑2025, USD 3.7750 in Jan‑2026, hitting a peak of USD 7.6500 in May‑2026 before easing to USD 6.6000 in August, an approx. 8.9x increase from the starting point. 1Gb‑SLC rose from USD 0.6000 to USD 4.3000, roughly 7.2x.
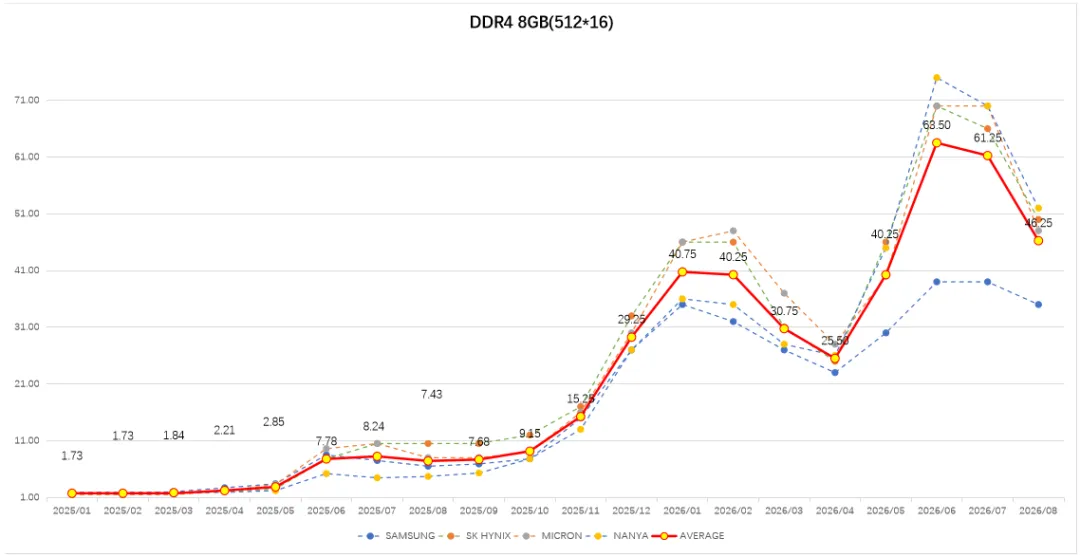
DRAM spot volatility is even more extreme. DDR4 8Gb spot price stood near USD 1.73 in early‑2025, surged to USD 29.25 in Dec‑2025, peaked at USD 63.50 in June‑2026 and retreated to USD 46.25 in August.
More critical than price surges is the fundamental shift in market drivers. According to SMCC market intelligence reports, AI infrastructure investment remains robust while memory markets diverge structurally. HBM acts as the key variable: HBM consumes far more wafer die area relative to its bit capacity. Samsung keeps lifting official DRAM pricing, and rising HBM wafer consumption continuously cannibalize regular DRAM output.
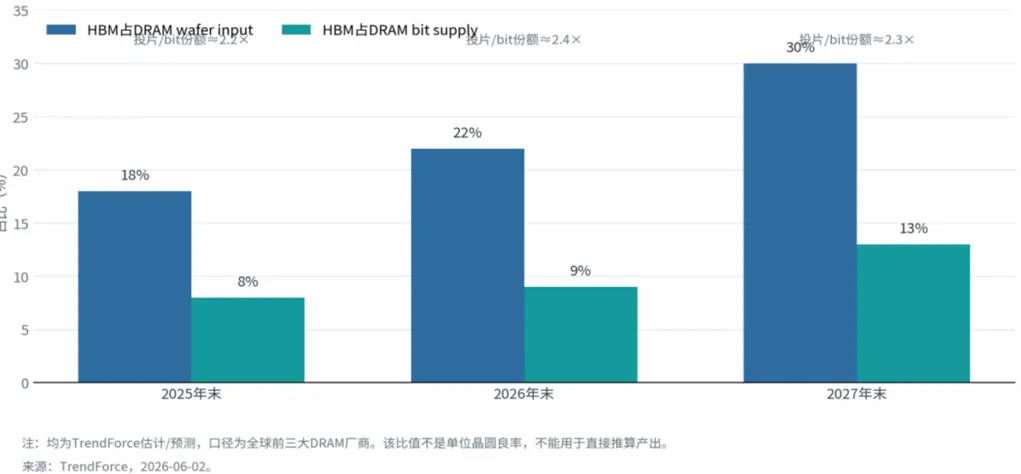
△ HBM occupies disproportionately larger wafer area share versus bit‑capacity share
The report outlines three‑stage scenarios for how this cycle may unwind:
Phase‑1: End‑customers become price‑sensitive, downgrade average memory configurations and order growth decelerates.
Phase‑2: New wafer and packaging capacity gradually ramps; broad shortages evolve into shortages for only specific SKUs.
Phase‑3: Should AI‑server growth decelerate, customer inventories rebuild and long‑term contract bookings cool off; the cycle transitions from localized softness toward a full correction.
Downside risks also require consideration: If AI infrastructure spending cools abruptly while advanced‑packaging yields and new wafer capacity improve faster than projected, HBM and server DRAM could enter inventory correction without an extended divergence phase. Long‑term supply contracts can mitigate shocks yet cannot fully offset downward demand‑expectation revisions.
Power Semiconductors
AI & Grid Infrastructure Stretch 8‑Inch Capacity; Watch for Post‑Q4 Oversupply Risks
Power semiconductors represent one of this year’s most crowded market segments. During H1‑2026, over 20 global power‑device majors including Infineon, TI and STMicroelectronics rolled out two rounds of price increases on April‑1 and July‑1, driven by AI and grid‑equipment demand. Certain AI power components report lead‑times extending up to 40 weeks with steep price inflation.
Supply tightness stems from capacity mismatch: power devices are predominantly manufactured on 8‑inch mature wafers, which are heavily consumed by AI‑related workloads. TSMC has reduced 8‑inch power‑device allocations, while domestic 8‑inch foundries prioritize AI‑related orders and tighten component quotas. Meanwhile, 8‑inch‑fabricated power chips deliver superior cost‑performance, accelerating downstream adoption and further tightening 8‑inch supply.
Nevertheless, industry outlook for the medium‑to‑long term turns cautious. Substantial new capacity from second‑tier power IC vendors and wafer foundries is scheduled to enter production from Q4 through next year. Coupled with intense market competition, low‑end power‑device segments risk oversupply, potentially eliminating many smaller power‑chip manufacturers. Supply‑demand stays tight in Q3‑2026, yet medium‑term oversupply risks are building up.
MLCC
Four Price Hike Announcements Within Four Months
Lead‑times for high‑grade MLCC have stretched to 4‑6 months. Earnings reports confirm market tightness: Murata’s Q2 MLCC new‑order intake rose 85.5% YoY, with an additional JPY 80 billion earmarked specifically for server‑grade MLCC capacity expansion. Samsung Electro‑Mechanics recorded 106.7% YoY operating‑profit growth in Q2.
AI servers constitute the major incremental demand source. AI‑server MLCC consumption will rise 87% YoY in 2026, projected to grow another 88% in 2027. A single AI rack consumes between 440,000 and 600,000 MLCC components, creating substantial gaps also for inductor products.
Suppliers are proactively constraining output. Taiyo Yuden cut production by 40%, creating roughly 20‑billion‑piece high‑capacitance MLCC shortfall; Samsung implemented a 16% overall production reduction. Samsung has secured large‑volume AI‑customer orders for part number 0402 476, the same SKU previously ordered by AI‑server clients from Taiyo Yuden. Murata remains hesitant, concerned over the longevity of AI‑server‑driven demand.
MCU, Analog & Component Distribution
Price‑Hike Transmission Varies Across Product Segments
MCU: Cooling‑Off During Seasonal Slowdown
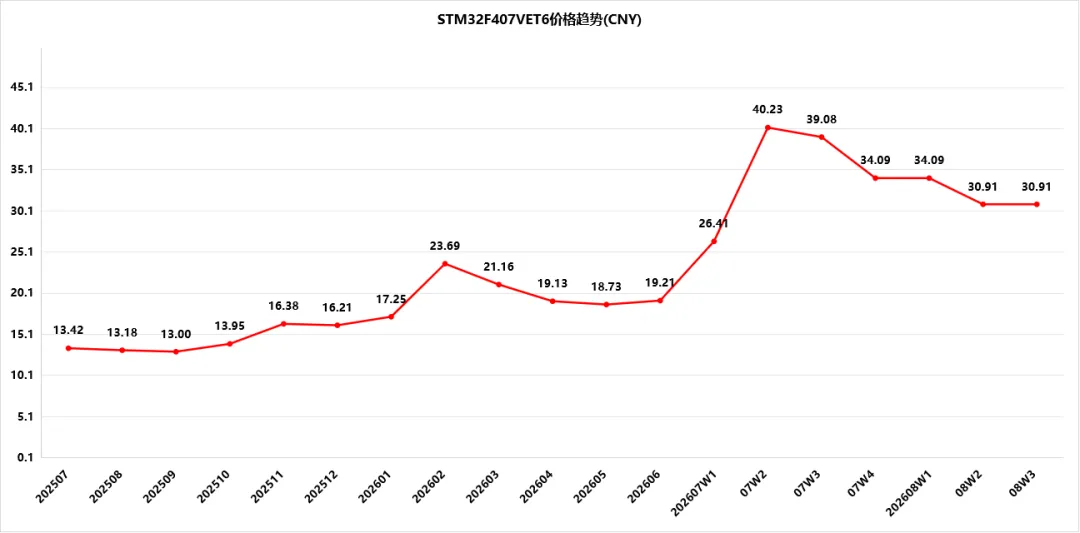
Take STM32F407VET6 from STMicroelectronics as an example: its spot price hit USD 3.38 in Feb‑2026, surged to USD 5.74 in week‑2 of July before falling back, stabilizing near USD 4.42 through July‑August. Increased stock arrivals coincide with the traditional industry off‑season, softening market sentiment.
Analog ICs: OEM Inventory Rationalization, Harder Channel Sourcing
TI is executing a large‑scale production migration from 8‑inch to 12‑inch wafers, stretching general lead‑times to 12‑20 weeks and rolling out new price increases, although spot‑market absorption remains muted. For reference, TPS54331 spot price spiked to USD 0.27 in August then retreated to USD 0.20.
For domestic Chinese analog‑chip vendors, most of the 24 listed companies report falling inventory‑turnover days and improved stock rotation. End‑demand is stronger than in prior years; selected products face tighter supply, extended lead‑times and firming prices. Even as spot markets improve, cost increases require time to trickle down to downstream customers, and distributors are not automatically enjoying expanded profit margins.
Distribution: Inventory De‑Stocking Nears Completion
Among large global distributors, Arrow’s inventory turnover accelerated from 5.0 to 6.0; Avnet cut inventory days from 95 days down to 71 days. Domestic distributors report steady overall revenue and profit uplifts fueled by AI‑related orders, prioritizing faster inventory turns while spot‑inventory levels keep declining.
Major semiconductor OEMs posted mostly rising order intake in August with generally low inventory levels. TI stands as an outlier with comparatively high 196‑day inventory; its price increases may trigger customer front‑loading that consumes OEM on‑hand stock. ON Semiconductor faces the most severe component shortages. NXP’s falling inventory reflects genuine recovery within automotive and industrial end‑markets.
SMCC (Smart Chip Cloud)
Market Summary & Sourcing Recommendations
Price‑increase expectations are widely accepted across the industry. Pricing strength follows a clear tier sequence: Advanced process nodes, 8‑inch power‑device platforms, 12‑inch specialty processes, standard mature nodes. General‑purpose mature‑node and consumer‑oriented chips lack fundamentals for broad‑based price inflation.
Inventory buffers are extremely thin. Average OEM inventory of 118‑day supply marks a three‑year low, meaning any demand pulse directly translates into price movement and lead‑time extensions. Among major suppliers, TI holds high inventory at 196 days and could draw forward buying upon price announcements; ON Semiconductor experiences acute supply shortages; NXP’s shrinking inventory reflects genuine automotive‑industrial demand recovery.
Medium‑term risks concentrate on power‑device and low‑end product categories. New capacity expansions from second‑tier suppliers will ramp from Q4 through next year, likely creating oversupply in low‑end power‑IC segments and forcing consolidation among smaller power‑chip manufacturers.
Segment‑by‑segment assessment
Wafer foundry & advanced nodes: Supply tightness for 8‑inch power‑device platforms and 12‑inch specialty processes will likely last until end‑2027. Secure long‑term foundry agreements proactively to avoid unfavorable quota allocations amid rising prices.
Memory & MLCC: These segments enjoy peak prosperity yet saw partial pullbacks in August. NAND spot prices dropped from USD 7.65 peak to USD 6.60; high‑cap MLCC retreated from USD 0.078 to USD 0.051. Risks of chasing price tops are elevated; procure based on real consumption and avoid over‑stocking at high price points.
Domestic analog ICs & ST MCUs: For local analog chips, demand recovery precedes full price appreciation, creating a favorable window for price‑locking. ST MCU spot prices have cooled from July highs as stock becomes available, opening opportunities for alternative‑component qualification and adoption.
-

In June 2026, global semiconductor market sales hit USD 134.45 billion, representing a 123.6% year‑on‑year increase and 16 straight months of sequential growth, standing at an all‑time high.
-
-
In June 2026, global semiconductor monthly sales reached USD 134.45 billion, a year-on-year increase of 123.6%, marking the 16th consecutive month of sequential growth.
-
SMCC now offers a comprehensive portfolio of Nexperia discrete semiconductors from stock, including Schottky diodes, fast-switching diodes, Zener diodes, MOSFETs, bipolar transistors, ESD protection devices, power devices and logic ICs.

Contact 10Marina Boulevard #47-01 Marina Bay Financial CentreTower 2 Singapore 018983 TEL:00852-6763-0779 E-mail:sales@smartcore-cloud.com
SOCIAL


Natural resources
